Viewing Device Status on Monitor Page
The Web interface's Monitor page provides basic status and information on the device. The page is useful in that it allows you to easily obtain an overview of the device's operating status at a glance.
|
➢
|
To view device status and information on the Monitor home page: |
|
■
|
On the Menu bar, click Monitor or if you are already in the Monitor menu's Navigation tree, click  Monitor. Monitor. |
The Monitor page displays the following groups of information:
|
■
|
Top bar, displaying general device information:
|
|
●
|
Address: IP address of the device's OAMP interface |
|
●
|
Firmware: Software version currently running on the device |
|
●
|
S/N: Serial number of device |
|
●
|
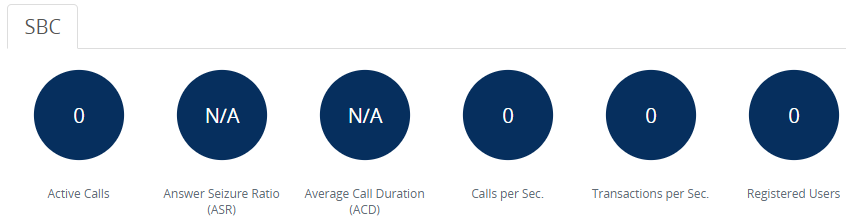
Active Calls: Displays the total number of currently active SBC calls. The corresponding SNMP performance monitoring MIB is acKpiSbcCallStatsCurrentGlobalActiveCallsIn.
|
|
●
|
Answer Seizure Ratio (ASR): Displays the number of successfully answered calls out of the total number of attempted calls. The corresponding SNMP performance monitoring MIB is acKpiSbcCallStatsCurrentGlobalAnswerSeizureRatio.
|
|
●
|
Average Call Duration (ACD): Displays the average call duration in seconds of established calls. The value is refreshed every 15 minutes and therefore, this value reflects the average duration of all established calls made within a 15 minute period. The corresponding SNMP performance monitoring MIB is acKpiSbcCallStatsCurrentGlobalAverageCallDuration.
|
|
●
|
Calls per Sec: Displays the total number of new calls per second (CPS).
|
|
●
|
Transactions per Sec: Displays the total number of new SIP transactions per second (out-of-dialog transactions such as INVITE and REGISTER, or in-dialog transactions such as UPDATE and BYE). The corresponding SNMP performance monitoring MIB is acKpiOtherStatsCurrentGlobalTransactionRate. |
|
●
|
Registered Users: Displays the percentage (%) of users currently registered with the device out of the device's maximum supported registered user capacity (regardless of any configurable limit). The corresponding SNMP performance monitoring MIB is acKpiOtherStatsCurrentGlobalRegisteredUsers.
|
|
■
|
Graphical Display of device: Shows color-coded status icons, as shown in the figure below and described in the subsequent table: |
Graphical Display of Device on Monitor Page - Mediant Software Session Border Controllers (SBC) - Cloud (CE), Virtual (VE) and Server (SE) Editions
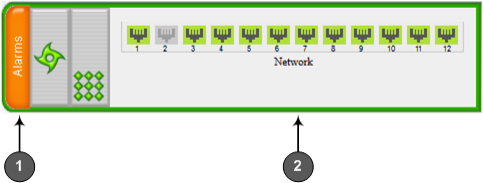
Description of Graphical Display of Device on Monitor Page
|
|
|
|
1
|
Alarms: Displays the highest severity of an active alarm raised (if any) by the device:
To view active alarms, click Alarms to open the Active Alarms page (see Viewing Active Alarms.
|
|
2
|
Gigabit Ethernet port status icons:
|
■
|
 (green): Ethernet link is working. (green): Ethernet link is working.
|
|
■
|
 (gray): Ethernet link is not configured. (gray): Ethernet link is not configured.
|
To view detailed port information, click the port icon. For more information, see Viewing Ethernet Port Information.
|